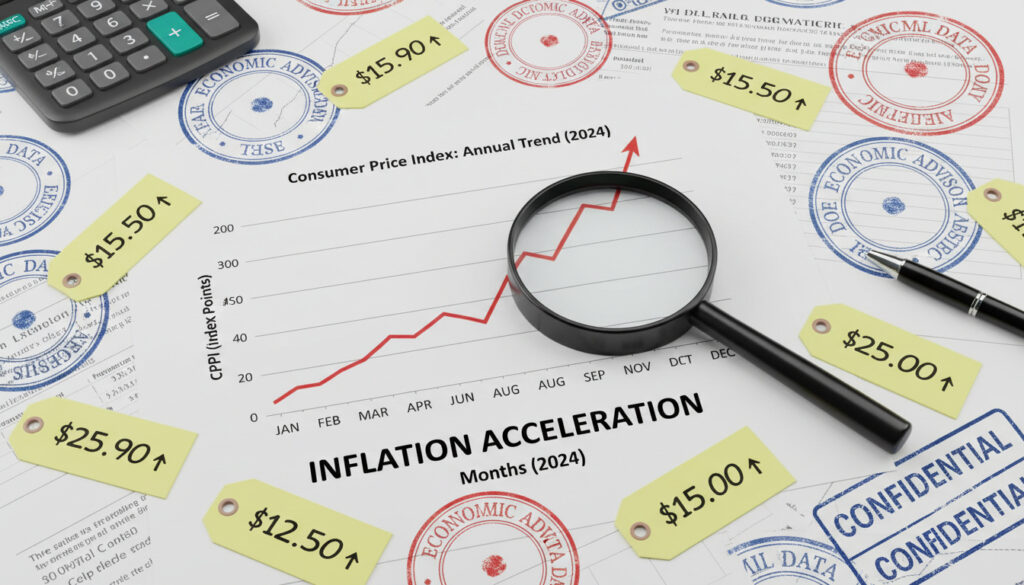
CPI Increase 2024 – Official Data and Trends
The Consumer Price Index for All Urban Consumers rose 2.9% from December 2023 to December 2024, marking a year of measurable disinflation even as core inflation metrics remained elevated. This figure, reported by the U.S. Bureau of Labor Statistics, represents the headline CPI increase for the full calendar year, with shelter costs dominating the underlying pressures while energy prices provided modest annual relief.
Core CPI, which excludes volatile food and energy categories, climbed 3.2% over the same period, persistently outpacing the headline rate and signaling sticky inflation within services sectors. Monthly data reveals significant volatility beneath the annual averages, with specific categories like motor vehicle insurance advancing 11.3% and shelter components contributing over sixty percent of the core increase.
Understanding these movements requires examining both the twelve-month trajectory and the specific monthly releases that tracked inflation’s gradual deceleration from March through December 2024. The following analysis breaks down the official data, explores the monthly progression, and identifies the specific economic forces driving consumer price changes throughout the year.
What Is the CPI Increase for 2024?
The definitive measure of consumer price inflation for 2024 stands at 2.9% year-over-year, calculated from December 2023 to December 2024 by the Bureau of Labor Statistics. This annual figure captures the total change in prices paid by urban consumers for a representative basket of goods and services, including all categories from shelter to transportation.
Key Insights from 2024 Data
- Shelter dominance: Housing costs accounted for over 60% of the total core CPI increase throughout 2024.
- Energy decline: Despite monthly volatility, energy prices fell 0.5% for the full year, with gasoline dropping 3.4%.
- Food moderation: Overall food inflation reached 2.5%, with at-home consumption rising 1.8% and away-from-home jumping 3.6%.
- Insurance surge: Motor vehicle insurance premiums climbed 11.3%, though down from 2023’s 20.3% spike.
- Core persistence: The 3.2% core reading consistently exceeded headline figures, indicating entrenched services inflation.
- Used vehicle deflation: Prices for previously owned cars and trucks declined 3.3% during the year.
Official 2024 CPI Data Table
| Period | Headline MoM (SA) | Headline YoY (NSA) | Core MoM (SA) | Core YoY (NSA) |
|---|---|---|---|---|
| March 2024 | +0.4% | +3.5% | +0.4% | +3.8% |
| November 2024 | — | — | — | +3.3% |
| December 2024 | +0.4% | +2.9% | +0.2% | +3.2% |
| Full Year 2024 (Dec–Dec) | N/A | +2.9% | N/A | +3.2% |
| January 2026 (12-mo ending) | N/A | +2.4% | N/A | N/A |
| February 2026 | +0.3% | +2.4% | +0.2% | +2.5% |
Source: Bureau of Labor Statistics, Department of Labor March 2024 Release, December 2024 CPI Report. November 2024 core figure inferred from month-over-month deceleration data.
What Are the Monthly CPI Changes in 2024?
Monthly CPI releases throughout 2024 revealed a pattern of deceleration punctuated by periodic volatility in energy categories. The March 2024 report established an early-year peak with headline CPI rising 0.4% month-over-month on a seasonally adjusted basis, yielding a 3.5% annual rate that would not be matched again during the calendar year.
Seasonal Adjustments and Data Collection
The Bureau of Labor Statistics publishes two distinct figures for each monthly release: seasonally adjusted (SA) month-over-month changes that account for typical seasonal patterns, and not-seasonally-adjusted (NSA) year-over-year comparisons that reflect actual price levels paid by consumers. The March 2024 data showed both metrics elevated, with shelter costs advancing 5.7% year-over-year and contributing disproportionately to the core reading.
Notable Monthly Volatility
December 2024 demonstrated the tension between monthly spikes and annual trends. While the month posted another 0.4% headline increase, energy prices jumped 2.6% and gasoline surged 4.4%, contributing approximately 40% of the monthly rise despite the category’s annual decline. This volatility illustrates why policymakers and analysts emphasize year-over-year core metrics when assessing inflationary pressure.
BLS data for the most recent 10–12 months remains subject to revision as additional survey responses are incorporated. The figures presented represent the latest available published data as of the February 2026 release cycle.
Is CPI Inflation Increasing or Decreasing in 2024?
The 2024 CPI trajectory established a clear disinflationary pattern, with headline inflation decelerating from 3.5% in March to 2.9% by December. However, the pace of this deceleration slowed compared to previous years, and core inflation remained stubbornly above 3%, complicating assessments of whether price pressures were truly abating.
The Disinflation Trajectory
Year-over-year headline CPI fell consistently throughout 2024, dropping 0.6 percentage points between March and December. Core CPI demonstrated similar but less pronounced deceleration, easing from 3.8% in March to 3.2% by year-end according to BLS annual review data. By February 2026, this trend continued with core reaching 2.5%, though the 2024 calendar year concluded with services inflation still elevated.
Comparison with 2023 Trends
The 2024 disinflation proved less dramatic than the corrections observed in the three preceding December-ending periods. Energy prices declined only 0.5% in 2024 compared to a 2.0% drop in 2023, while shelter costs remained elevated for longer into the year. This stickiness in housing and services inflation meant that while CPI was technically decreasing, the “last mile” toward the Federal Reserve’s 2% target remained elusive throughout the year.
Why Did CPI Increase in 2024?
Three primary forces shaped the 2024 CPI increases: persistent shelter cost acceleration, volatile but ultimately moderating energy prices, and divergent trends within core goods and services. Understanding these components explains why headline inflation decelerated while consumers continued facing significant price pressure in specific categories.
Shelter Dominance and Housing Costs
Housing-related expenses represented the single largest inflationary force throughout 2024. Shelter costs rose 5.7% year-over-year through March and remained the dominant factor in core CPI increases, accounting for over sixty percent of the total rise. This category’s weight in the consumption basket and its slow response to interest rate changes created persistent upward pressure even as other components moderated.
Shelter costs alone contributed more than 60% of the core CPI increase during 2024, according to BLS category weighting and contribution analysis. This disproportionate impact explains why core inflation remained elevated at 3.2% despite goods price stabilization.
Energy Volatility and Category-Specific Pressures
Energy markets delivered contradictory signals in 2024. While the annual average showed a 0.5% decline—driven by gasoline’s 3.4% drop and offset by electricity’s 2.8% rise and utility gas service’s 4.9% increase—monthly figures swung dramatically. The December 2024 report captured this tension, with a 4.4% monthly gasoline spike driving temporary headline increases.
While energy prices declined 0.5% for the full year 2024, monthly volatility created significant short-term inflation spikes. December’s energy surge contributed 40% of that month’s total CPI increase, demonstrating why policymakers emphasize year-over-year core metrics for strategic decisions.
Services and Goods Divergence
The bifurcation between services and goods inflation defined 2024’s economic landscape. Motor vehicle insurance premiums surged 11.3%, medical care rose 2.8%, and personal care services accelerated. Conversely, used car prices deflated by 3.3% and certain pharmaceutical categories declined. This divergence, detailed in the BLS 2024 annual review, illustrates the uneven recovery from prior supply chain disruptions.
Core services maintained inflationary pressure through insurance and healthcare costs. By February 2026, medical care services reached 3.4% year-over-year increases, while personal care products hit 4.5%, suggesting continued services sector pressure beyond the 2024 calendar year.
Timeline of CPI Releases and Economic Milestones
- March 2024: BLS reports 3.5% YoY headline CPI and 3.8% core, establishing the year’s inflation peak with shelter costs at 5.7%. Source: Department of Labor Economic Data
- Mid-2024: Unreported months showed gradual deceleration toward the annual average, with energy prices providing intermittent volatility.
- December 2024: Year-end report confirms 2.9% annual increase and 3.2% core CPI, with gasoline spiking 4.4% monthly but falling 3.4% annually. Source: BLS December Release
- January 2025: BLS publishes comprehensive 2024 annual review confirming category weights and contributions. Source: BLS TED Report
- February 2026: Subsequent data shows continued disinflation to 2.4% headline and 2.5% core, validating 2024’s trajectory. Source: Trading Economics
Certainty and Data Limitations in 2024 CPI Analysis
Established Data
- Annual headline CPI increase of 2.9% (Dec 2023–Dec 2024) officially published by BLS
- Core CPI at 3.2% for the same period
- March and December monthly figures of +0.4% seasonally adjusted
- Shelter’s 60%+ contribution to core increases
- Energy’s annual 0.5% decline and gasoline’s 3.4% drop
Ongoing Revisions
- Precise monthly figures for April–October 2024 subject to BLS revision cycles
- Final category weights and seasonal factors for mid-year months remain preliminary
- Exact quantitative impact of specific Fed policy decisions on 2024 price levels remains inferential
- Forecasts for 2026–2028 (2.8%, 2.6%, 2.4%) represent model projections, not historical data
Economic Context and Global Considerations
The 2024 CPI data emerged against a backdrop of restrictive monetary policy, with the Federal Reserve maintaining elevated interest rates to combat residual inflation. The persistence of core CPI above 3% throughout the year influenced these policy decisions, as services inflation proved less responsive to rate hikes than goods inflation. For international comparisons of inflation metrics and currency impacts, see Aud to Rupiah – Current Rate, Trends and Forecast.
Consumer impacts varied significantly by expenditure category. While households benefited from declining used vehicle prices and moderate food inflation at 2.5%, they faced severe pressure from housing costs and insurance premiums. This uneven distribution of price changes meant that inflation experienced by individual consumers depended heavily on their specific consumption baskets, with renters and vehicle owners facing disproportionate burdens compared to homeowners or public transit users.
The divergence between headline and core metrics created complex signals for financial markets. While the 2.9% annual headline figure suggested normalization, the 3.2% core reading indicated underlying price stickiness that complicated forward-looking economic planning. This dynamic remains relevant for understanding how energy markets and service sectors interact within broader inflation indices.
Official Sources and Methodological Notes
“The Consumer Price Index for All Urban Consumers increased 2.9 percent from December 2023 to December 2024. The index for all items less food and energy rose 3.2 percent over the last 12 months.”
— Bureau of Labor Statistics, Consumer Price Index Summary, December 2024
“The shelter index continued to rise, increasing 0.3 percent in December and contributing over sixty percent of the monthly all items increase.”
— Bureau of Labor Statistics, Consumer Price Index 2024 in Review
Primary data originates from the Bureau of Labor Statistics within the Department of Labor, which conducts the Consumer Expenditure Surveys and calculates index weights. For those tracking utility costs and energy price components specifically, the Energy Australia App – Features, Setup and Usage Guide provides relevant consumer tools for monitoring electricity and gas expenditures, though this reference reflects Australian market applications rather than U.S. BLS methodologies.
Supplemental forecast data from Trading Economics indicates core CPI projections of 2.8% by mid-2026, trending toward 2.4% by 2028, though these models incorporate assumptions beyond the verified historical record. JPMorgan economic outlook reports note the deceleration from November’s 3.3% core reading to December’s 3.2%, confirming the gradual nature of 2024’s disinflation.
Conclusion: Interpreting the 2024 CPI Landscape
The 2024 CPI increase of 2.9% represents a year of transition—disinflationary in direction but persistent in magnitude, particularly within core services. While headline figures approached pre-pandemic norms, the 3.2% core CPI and shelter’s dominant contribution revealed structural inflationary pressures that monetary policy struggled to resolve. As subsequent data through February 2026 confirms continued gradual cooling toward 2.4%, the 2024 experience underscores the complexity of measuring economic health through aggregate price indices when household experiences vary dramatically by spending category.
Frequently Asked Questions
What does the Consumer Price Index measure?
The CPI tracks average price changes over time for a basket of goods and services purchased by urban consumers, including housing, food, transportation, medical care, and education.
How is CPI data calculated?
BLS data collectors gather prices monthly from retail establishments and housing units across the country, weighting each category according to consumer spending patterns derived from expenditure surveys.
What distinguishes CPI from core CPI?
Core CPI excludes food and energy categories to reduce volatility, while headline CPI includes all items. In 2024, headline was 2.9% and core was 3.2%.
Why did shelter costs dominate 2024 inflation?
Housing costs carry heavy weight in the consumption basket and adjust slowly to economic conditions, contributing over 60% of core CPI increases throughout 2024.
How did energy prices affect 2024 CPI?
Energy declined 0.5% annually but caused monthly volatility, with gasoline dropping 3.4% for the year while spiking 4.4% in December alone.
What is the Federal Reserve’s inflation target?
The Fed targets 2% inflation over the long run, typically emphasizing core PCE rather than CPI, though elevated 3.2% core CPI in 2024 influenced restrictive policy.
Are 2024 CPI figures final?
BLS data for recent months remains subject to revision. Figures from the past 10–12 months may change as additional survey responses are incorporated.
Where can I find the latest CPI charts?
The BLS maintains interactive category charts at bls.gov/charts/consumer-price-index/, showing 12-month percentage changes by component.
More related posts
 1600 USD to AUD – Live Rate, Trends and Comparisons
 Liv Golf Adelaide 2026 – Dates, Venue, Tickets and Full Details
 Top Famous People in the World: 2026 Rankings Compared
 Leisel Jones: Life, Weight Loss & Radio Career
 Tesla Model Y Price Ireland: €50,527 & Comparisons
 French Montana: Biography, Relationships, and Sobriety
 Zim vs Aus Head to Head: Records & 2026 T20 World Cup
